Why You Must Run a Website Speed Test
Imagine you click a link to a site and wait … and wait … and then close it out of frustration. That’s a potential user (or customer) lost forever. In 2025, web visitors are less patient than ever — if your site doesn’t load quickly, you’re bleeding traffic, conversions, and credibility.
That’s why doing a website speed test isn’t just optional — it’s essential. In this guide, you’ll:
- Learn exactly how to run a website speed test
- Uncover hidden issues slowing your site
- Get step-by-step fixes to speed things up
- Walk away with tools, checklists, and confidence
By the end, your site will feel noticeably faster — and your visitors will thank you.
What Is a Website Speed Test?
Before diving into tools, let’s clarify:
A website speed test measures how long your web pages take to load and highlights performance bottlenecks. It gives you metrics such as:
- First Contentful Paint (FCP)
- Largest Contentful Paint (LCP)
- Time to Interactive (TTI)
- Total Blocking Time (TBT)
- Cumulative Layout Shift (CLS)
These numbers show both user experience and technical glitches. A good website speed test tool will also report resource issues (e.g. large images, slow scripts, render-blocking CSS).
Why these matter:
- Users perceive your site as “slow” if FCP or LCP takes too long
- Search engines (Google) use these metrics for ranking
- You can zero in on what’s really slowing you down
Top Website Speed Test Tools You Need to Use
No single tool is perfect, so I recommend using 2–3 tools for cross-checking. Here are my favorites:
| Tool | What It Measures | Best Use Case |
|---|---|---|
| Google PageSpeed Insights | Core Web Vitals, performance, diagnostics | Great first check; Google’s own tool |
| GTmetrix | Waterfall, detailed resource breakdown | For advanced debugging |
| WebPageTest | Deep test, filmstrip view, multi-location | For in-depth performance analysis |
| Lighthouse (Chrome DevTools) | Performance audit + accessibility + SEO | Build-in developer tool |
| Pingdom Speed Test | Simple and quick overview | Basic, user-friendly report |
How to Use Them (quick steps)
- Open the tool (PageSpeed Insights or GTmetrix)
- Enter your URL / homepage or page to test
- Choose test location (closest to your audience)
- Run test & wait 10–20 seconds
- Review results, metrics, and recommendations
Make sure you test multiple pages (homepage, blog post, landing pages, product pages, etc.) — performance can vary across pages.
Interpreting Your Test Results: What These Metrics Mean
After you run the test, you’ll see a lot of metric names and scores. Let’s demystify the most important ones:
- First Contentful Paint (FCP): Time when the first text/image element appears
- Largest Contentful Paint (LCP): Time for the largest above-the-fold element (e.g. hero image)
- Time to Interactive (TTI): When the page becomes fully interactive
- Total Blocking Time (TBT): How long scripts blocked user interactions
- Cumulative Layout Shift (CLS): Visual stability / unexpected page movements
Red flags to watch for:
- LCP > 2.5 seconds
- TBT is high (hundreds of ms)
- CLS > 0.1
- Large “render-blocking” resources
- Huge images, fonts, or third-party scripts
Your goal: Push those green metrics, minimize reds. A solid benchmark: LCP under 2.5s, CLS under 0.1, and TBT low.
Top 10 Hidden Issues Slowing Your Site (and How to Fix Them)
Let’s dig into common issues many people miss — and how you can plug those leaks. After running a website speed test, these are your likely culprits.
Oversized Images & Wrong Formats
Problem: Loading full-size, uncompressed images slows down LCP and FCP.
Fixes:
- Resize images to the display size (don’t upload 3000px when you need 800px)
- Use modern formats (WebP, AVIF)
- Lazy-load offscreen images
Unoptimized Fonts & Font Loading
Problem: Custom fonts block rendering or delay text display.
Fixes:
- Use
font-display: swap; - Preload critical fonts
- Limit the number of font families or weights
Render-Blocking CSS & JavaScript
Problem: CSS and JS blocks the browser from painting the page.
Fixes:
- Inline critical CSS
- Defer non-critical CSS & scripts
- Split JS bundles and load asynchronously
Too Many HTTP Requests
Problem: Every script, CSS, image, font means another request = slower load.
Fixes:
- Combine CSS/JS where possible
- Use sprites or data URIs
- Remove unused CSS/JS
Slow Server Response / Backend Latency
Problem: Even before front-end loads, your server is slow to respond.
Fixes:
- Choose faster hosting (SSD, fewer shared users)
- Use caching (page, object, database)
- Use Content Delivery Network (CDN)
Lack of Caching / Poor Cache Strategy
Problem: Every visitor reloads everything anew.
Fixes:
- Use browser caching for static resources
- Employ server-side caching layers (Varnish, Redis)
- Use caching plugins if using CMS like WordPress
Third-Party Scripts & Ads
Problem: Analytics, chat widgets, ads, tracking scripts often slow things down.
Fixes:
- Audit and remove unnecessary third-party scripts
- Load them asynchronously or defer
- Delay loading non-essential scripts (after main content)
Not Using a CDN
Problem: All assets served from one location, higher latency for users far away.
Fixes:
- Use a global CDN (Cloudflare, AWS CloudFront, etc.)
- Offload static assets to CDN (images, CSS, JavaScript)
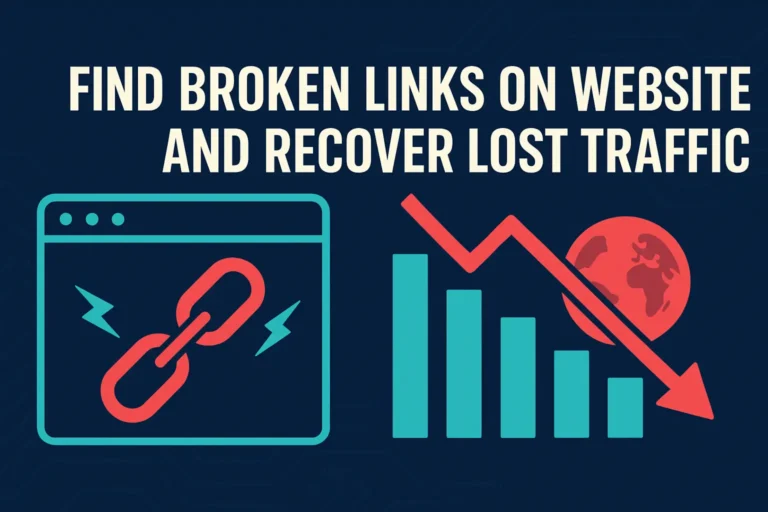
Poorly Executed Redirects & Broken Links
Problem: Redirect chains or broken links slow down initial load.
Fixes:
- Fix or eliminate unnecessary redirects
- Use direct paths
- Regularly audit and remove broken links
Large CSS or JS Libraries Not Trimmed
Problem: Bulk libraries (e.g. full jQuery, big UI frameworks) with unused parts.
Fixes:
- Use modular builds (import only what you need)
- Tree-shaking / remove dead code
- Use lighter alternatives
Step-by-Step Checklist: After Your Website Speed Test
Use this checklist right after your speed test to drive improvements:
- Document baseline metrics (FCP, LCP, TBT, CLS)
- Prioritize issues by impact (LCP or TBT first)
- Tackle quick wins (compress images, lazy load, font swap)
- Fix moderate issues (deferring scripts, CSS splitting)
- Address backend & hosting (caching, faster server, CDN)
- Re-run tests (after each major change)
- Compare before/after graphs
- Keep iterating monthly (performance decays over time)
- Monitor with real user data (e.g. Google Analytics, Real User Monitoring)
- Document improvements & maintain logs
Real‑World Case Study (Hypothetical Example)
Let’s walk through a scenario of what many site owners experience:
- Baseline: Homepage LCP = 4.2 s, CLS = 0.2, many scripts flagged
- Problem found: Oversized hero image, unoptimized fonts, chat widget blocking
- Fix steps:
- Convert hero image to WebP, resize
- Inline critical CSS, defer rest
- Use
font-display: swap, remove unused font weights - Delay chat widget load until after page interaction
- Migrate to a CDN and enable caching
- Result after re-test: LCP = 1.9 s, CLS = 0.05, overall performance score jumped by 40+ points
If this site was losing 45% of mobile visitors due to slow speed — those gains translate to real business impact.
Advanced Techniques & Bonus Tips
Real User Monitoring (RUM): Tools like New Relic, Datadog, or Boomerang collect real users’ performance data
Progressive Web App (PWA): Use service workers and caching for super fast repeat visits
Prefetch & Preload: Preload next page’s assets (links users are likely to click)
Server Push (HTTP/2): Push critical assets proactively
AMP (Accelerated Mobile Pages): For content-heavy, news or blog sites
Performance budgets: Set limits (e.g. total JS < 200 KB) and enforce them
How Often Should You Run a Website Speed Test?
Monthly tests: Spot regressions after updates
After major changes: New theme, plugin, big media uploads
Before/after launches or redesigns
Use continuous monitoring: Tools like Pingdom, UptimeRobot, web performance dashboards
Common Myths & Mistakes to Avoid
Myth: “If my score is 100, it’s perfect.”
Truth: Lab scores are estimates; real user metrics matter more.
Mistake: Over-optimizing on desktop only
Better: Focus on mobile-first performance.
Myth: “Third-party scripts don’t matter.”
Truth: Many performance killers come from analytics, ads, tracking, social embeds.
Mistake: Fixing small issues while ignoring server-side problems
Better: Work both front-end and back-end.
Final Thoughts & Action Plan
You now understand:
- What a website speed test is
- How to run multiple tests and interpret metrics
- Hidden issues almost every site has
- A real path forward to fix and improve performance
Don’t just read — act. Run one test today, pick 2–3 fixes from the list, and re-test tomorrow. The difference will surprise you (and your users will feel it too).
Frequently Asked Questions (FAQ)
Q: Is there a “best” website speed test tool?
A: No single tool covers everything. Use PageSpeed Insights for Core Web Vitals, GTmetrix for resources, and WebPageTest for deep insights.
Q: Will improving website speed help SEO?
A: Yes — Google uses performance (Core Web Vitals) as a ranking factor. A faster site improves UX and search visibility.
Q: Can plugins help speed optimization?
A: Yes, caching, image optimization, and minification plugins help — but misconfigured ones can hurt too. Always test after adding one.
Q: Does hosting impact speed a lot?
A: Absolutely. A sluggish server amplifies every performance problem. Investing in quality hosting pays off hugely.
Q: What’s an acceptable LCP / CLS in 2025?
A: Aim for LCP < 2.5 seconds and CLS < 0.1. These thresholds align with Google’s Web Vitals guidelines.